
Bacteriome and Mycobiome Interactions Underscore Microbial Dysbiosis in Familial Crohn’s Disease
Abstract
Crohn’s disease (CD) results from a complex interplay between host genetic factors and endogenous microbial communities. In the current study, we used Ion Torrent sequencing to characterize the gut bacterial microbiota (bacteriome) and fungal community (mycobiome) in patients with CD and their nondiseased first-degree relatives (NCDR) in 9 familial clusters living in northern France-Belgium and in healthy individuals from 4 families living in the same area (non-CD unrelated [NCDU]). Principal component, diversity, and abundance analyses were conducted, and CD-associated inter- and intrakingdom microbial correlations were determined. Significant microbial interactions were identified and validated using single- and mixed-species biofilms. CD and NCDR groups clustered together in the mycobiome but not in the bacteriome. Microbiotas of familial (CD and NCDR) samples were distinct from those of nonfamilial (NCDU) samples. The abundance of Serratia marcescens and Escherichia coli was elevated in CD patients, while that of beneficial bacteria was decreased. The abundance of the fungus Candida tropicalis was significantly higher in CD than in NCDR (P = 0.003) samples and positively correlated with levels of anti-Saccharomyces cerevisiae antibodies (ASCA). The abundance of C. tropicalis was positively correlated with S. marcescens and E. coli, suggesting that these organisms interact in the gut. The mass and thickness of triple-species (C. tropicalis plus S. marcescens plus E. coli) biofilm were significantly greater than those of single- and double-species biofilms. C. tropicalis biofilms comprised blastospores, while double- and triple-species biofilms were enriched in hyphae. S. marcescens used fimbriae to coaggregate or attach with C. tropicalis/E. coli, while E. coli was closely apposed with C. tropicalis Specific interkingdom microbial interactions may be key determinants in CD.
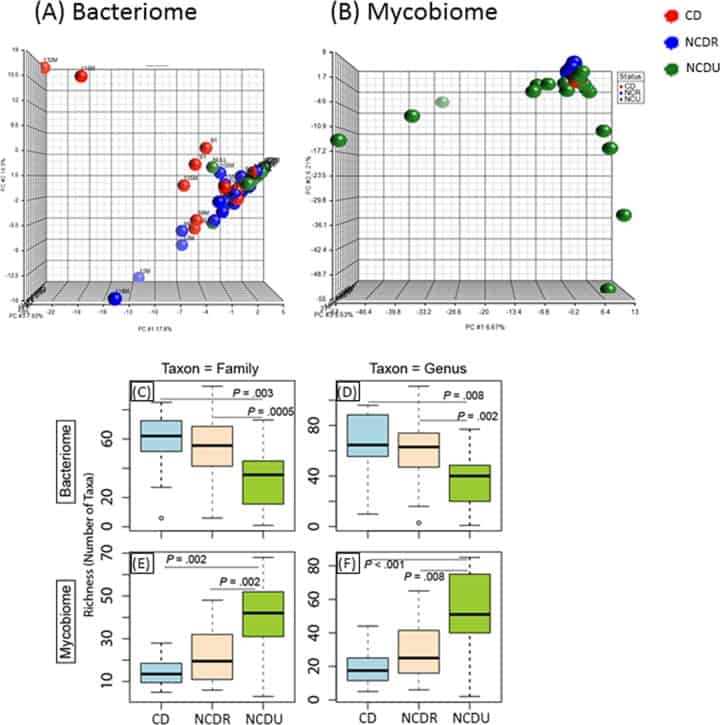
Figure 1
Distribution of bacteriome and mycobiome in enrolled individuals. (A and B) Clustering of genera in bacteriome (A) and mycobiome (B) in Crohn’s disease (CD), non-Crohn’s disease relative (NCDR), and non-Crohn’s disease unrelated individual (NCDU) groups. (C to F) Richness of microbiota in bacteriome (C and D) and mycobiome (E and F) at fungal family, genus, and species taxon levels.
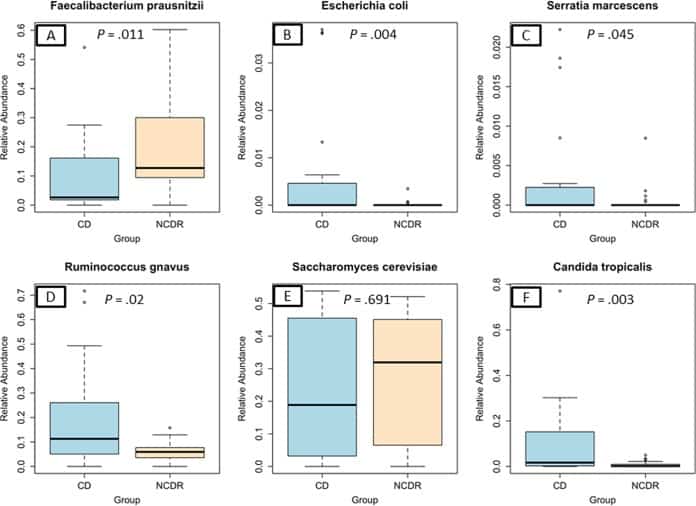
Figure 2
Abundance of CD-associated bacterial and fungal species in study participants. (A) Faecalibacterium prausnitzii. (B) Escherichia coli. (C) Serratia marcescens. (D) Ruminococcus gnavus. (E) Saccharomyces cerevisiae. (F) Candida tropicalis.
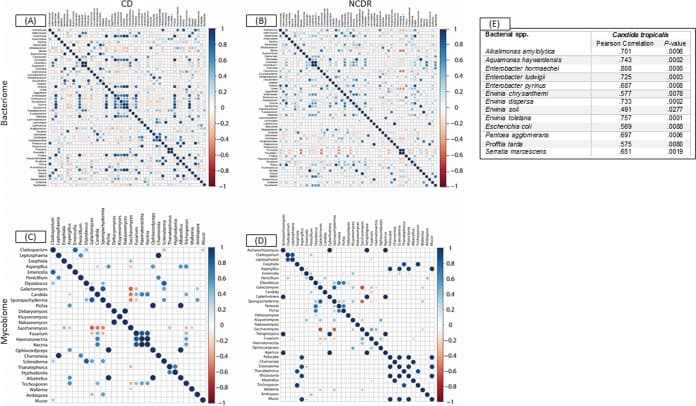
Figure 3
Associations among bacterial and fungal genera in CD patients (A and C) and their cohabiting non-CD relatives (B and D). (A and B) Bacteriome. (C and D) Mycobiome. Red circles indicate negative associations, while blue circles indicate positive associations. Diameters of circles indicate the magnitude of the correlation (−1 through +1) for each fungal pair. Only significant associations (P < 0.05) are shown.
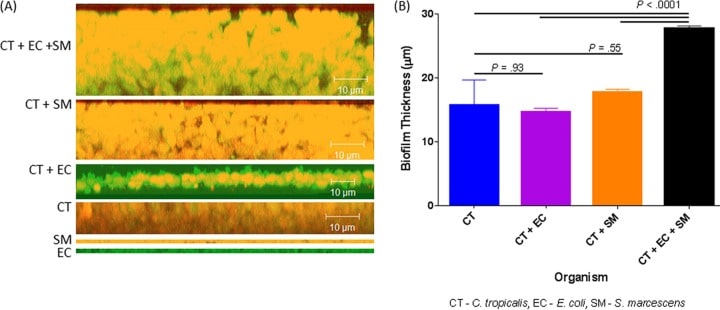
Figure 4
Confocal analysis of biofilms formed by C. tropicalis (CT) alone or in combination with E. coli (EC) and/or S. marcescens (SM). (A) Side view of biofilms formed by C. tropicalis plus E. coli plus S. marcescens, C. tropicalis plus S. marcescens, C. tropicalis plus E. coli, C. tropicalis alone, S. marcescens alone, or E. coli alone. (B) Mean thickness of biofilms.
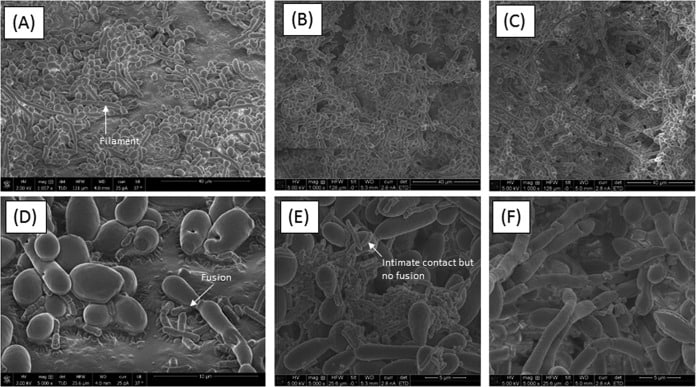
Figure 5
Scanning electron microscopy analyses of biofilms formed by C. tropicalis alone or in combination with E. coli and/or S. marcescens. (A) C. tropicalis plus E. coli (magnification, ×1,057); (B) C. tropicalis plus S. marcescens (magnification, ×1,000); (C) C. tropicalis plus E. coliplus S. marcescens (magnification, ×1,000); (D) C. tropicalis plus E. coli (magnification, ×5,000); (E) C. tropicalis plus S. marcescens(magnification, ×5,000); (F) C. tropicalis plus E. coli plus S. marcescens (magnification, ×5,000).
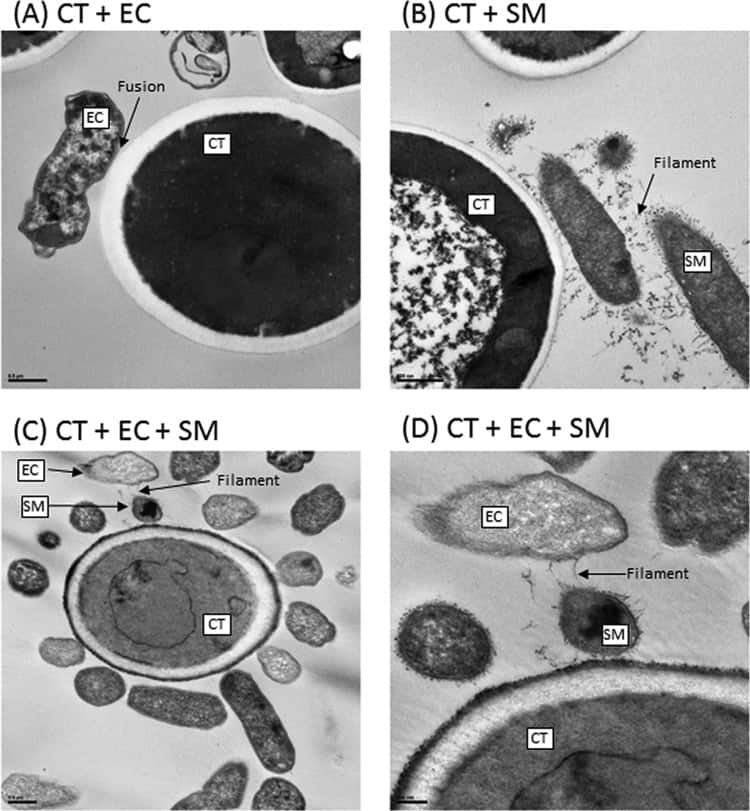
Figure 6
Transmission electron microscopy analyses of biofilms formed by C. tropicalis (CT) alone or in combination with E. coli (EC) and/or S. marcescens (SM). (A) C. tropicalis plus E. coli (bar, 0.5 µm); (B) C. tropicalis plus S. marcescens (bar, 500 nm); (C) C. tropicalis plus E. coli plus S. marcescens (bar, 0.5 µm); (D) C. tropicalis plus E. coli plus S. marcescens (bar, 200 nm).