
Alcohol Dehydrogenase Restricts the Ability of the Pathogen Candida Albicans to Form a Biofilm on Catheter Surfaces Through an Ethanol-based Mechanism
Abstract
Candida biofilms formed on indwelling medical devices are increasingly associated with severe infections. In this study, we used proteomics and Western and Northern blotting analyses to demonstrate that alcohol dehydrogenase (ADH) is downregulated in Candida biofilms. Disruption of ADH1 significantly (P = 0.0046) enhanced the ability of Candida albicans to form biofilm. Confocal scanning laser microscopy showed that the adh1 mutant formed thicker biofilm than the parent strain (210 microm and 140 microm, respectively). These observations were extended to an engineered human oral mucosa and an in vivo rat model of catheter-associated biofilm. Inhibition of Candida ADH enzyme using disulfiram and 4-methylpyrazole resulted in thicker biofilm (P < 0.05). Moreover, biofilms formed by the adh1 mutant strain produced significantly smaller amounts of ethanol, but larger amounts of acetaldehyde, than biofilms formed by the parent and revertant strains (P < 0.0001), demonstrating that the effect of Adh1p on biofilm formation is mediated by its enzymatic activity. Furthermore, we found that 10% ethanol significantly inhibited biofilm formation in vitro, with complete inhibition of biofilm formation at ethanol concentrations of >/=20%. Similarly, using a clinically relevant rabbit model of catheter-associated biofilm, we found that ethanol treatment inhibited biofilm formation by C. albicans in vivo (P < 0.05) but not by Staphylococcus spp. (P > 0.05), indicating that ethanol specifically inhibits Candida biofilm formation. Taken together, our studies revealed that Adh1p contributes to the ability of C. albicans to form biofilms in vitro and in vivo and that the protein restricts biofilm formation through an ethanol-dependent mechanism. These results are clinically relevant and may suggest novel antibiofilm treatment strategies.
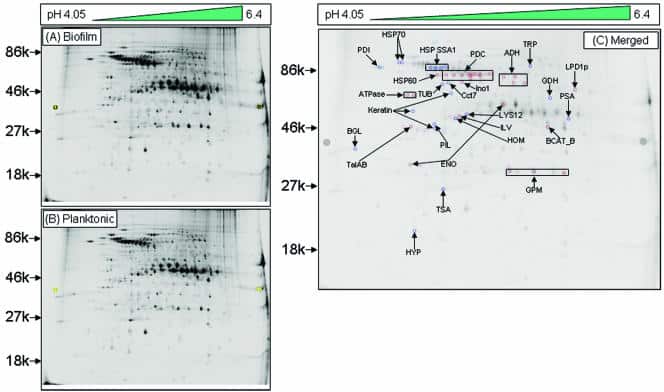
Figure 1
Alcohol dehydrogenase is downregulated in cell walls in the early phase of C. albicans biofilms. Two-dimensional DIGE analysis was performed with SDS-soluble cell wall proteins of C. albicans grown as a (A) biofilm (Cy-5 labeled) or (B) planktonic (Cy-3 labeled) form, followed by MALDI-time of flight mass spectrometry analysis. (C) Merged image (Cy5 and Cy3 overlap) showing 24 differentially expressed spots, including Adh1p, in C. albicans biofilms. An increase in the Cy5/Cy3 ratio (dark-blue spots) indicated proteins upregulated in biofilms, while an increase in the Cy3/Cy5 ratio (dark-red spots) indicated upregulated proteins in planktonic C. albicans. Proteins were identified by mass spectrometry analysis of the CWS fraction of C. albicans biofilm. The spot intensity was quantified with the spot normalized volume depending on the whole volume of the DIGE image after scanning the image using a Typhoon scanner. Sequence information from mass spectrometry analysis was matched with the online protein database NCBInr using the MatrixScience Mascot search site (http://www.matrixscience.com). Protein scores of greater than 58 were considered significant (P < 0.05).
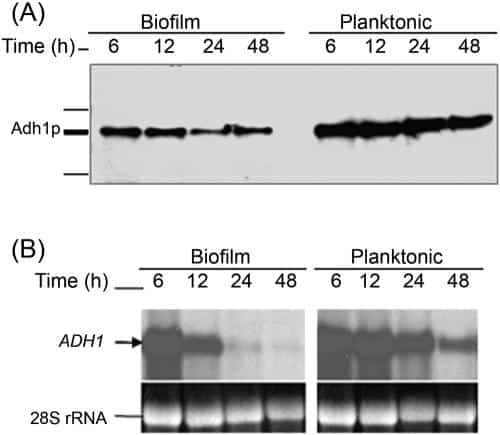
Figure 2
Correlation between protein and mRNA level expressions of Adh1p and its corresponding gene in C. albicans biofilms grown to different developmental phases. Temporal expression of ADH1 in C. albicansbiofilm during development was determined by (A) Western and (B) Northern blot analyses. As can be seen in panel A, Adh1p protein levels were lower in biofilms than in planktonic cells. (B) Levels of ADH1 mRNA decrease in C. albicans biofilms with time, with no signal detected in mature biofilm.
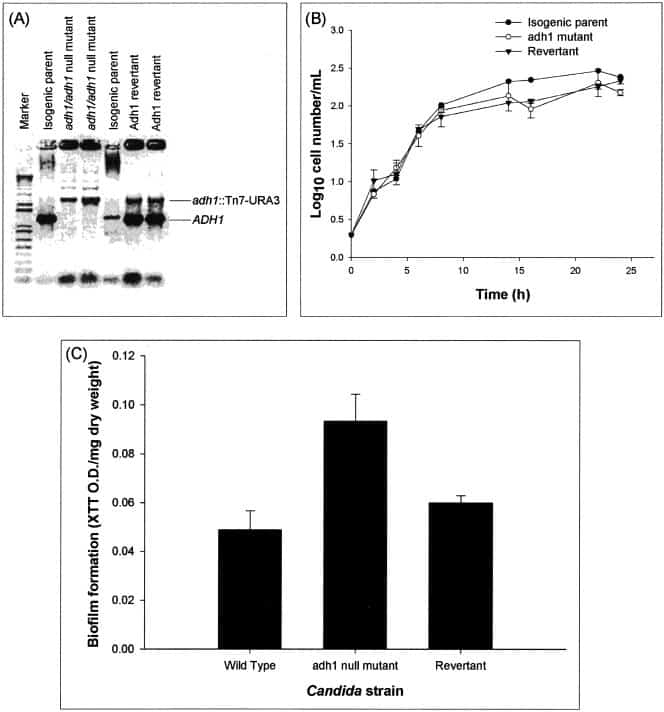
Figure 3
Disruption of the C. albicans ADH1 gene increases the ability of C. albicans to form biofilm in vitro. (A) Disruption of ADH1 gene. (B) Effect of disruption of the ADH1 gene on the growth curve of planktonic C. albicans. (C) Biofilm formation by the wild-type, adh1 mutant, and revertant strains of C. albicans. The adh1/adh1 mutant strain was constructed from strain BWP17 through use of a Tn7-UAU1 transposon insertion in the middle of the ADH1/orf19.3997 open reading frame as described by Davis et al. (16). The complemented strain was created by cloning the ADH1 ORF, along with 1,000 bp of 5′ flanking sequence and 500 bp of 3′ flanking sequence, in the HIS1 vector pDDB78. The resulting plasmid was transformed into the adh1/adh1 mutant with selection for His+ complementation. Disruption and reintroduction of the ADH1 gene were confirmed by PCR amplification, which revealed the presence of the expected 1,297-bp product in the wild-type parent strain and the ADH1 revertant strain, but not in the adh1 mutant. Biofilm formation by the isogenic strains was quantified as XTT OD/mg (dry weight) (biomass) of biofilm formed. Growth curve studies were performed twice, and a representative set of graphs is shown in panel B. The error bars represent standard deviations.
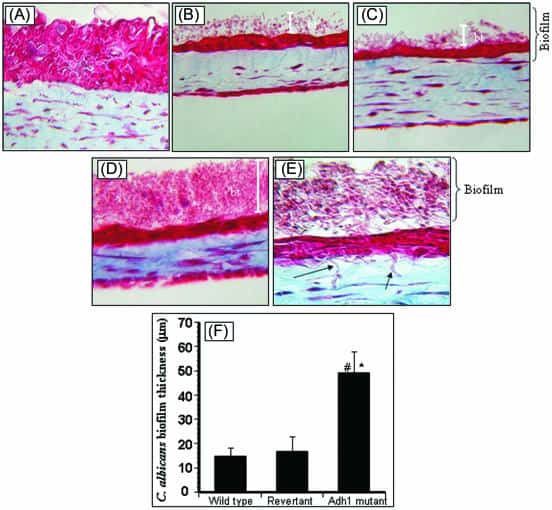
Figure 4
Effect of disruption of the ADH1 gene on the ability of C. albicans to form biofilms on EHOM tissue layers. Histological features of EHOM following exposure to isogenic C. albicans strains are shown. EHOM tissue was infected with (A) no Candida cells (uninfected control), (B) the parental C. albicans strain, (C) the revertant strain, or (D) the adh1 mutant strain. (E) Hyphae of the adh1 mutant infiltrating into the lamina propria of EHOM (arrow). (F) Quantitative assessment of the thickness of biofilm formed on EHOM tissues. Representative photographs of three different experiments are shown (two EHOMs per experiment). Magnification, ×250 for panel A, ×200 for panels B to D, and ×500 for panel E. * and #, P < 0.0001 compared to the wild-type or revertant C. albicans strain, respectively. The error bars represent standard deviations.
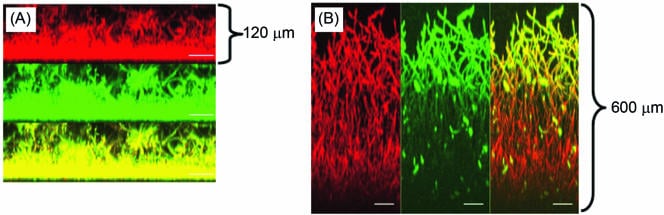
Figure 5
Effect of ADH inhibitor on C. albicans biofilms. CSLM analysis of biofilm formed in the (A) absence or (B) presence of disulfiram. Side view reconstructions of CSLM images revealed that incubation of biofilm with the inhibitor increased the thickness of mature-phase biofilm from (A) 120 μm to (B) 600 μm. Metabolically active fungal biofilm is indicated in red (due to FUN-1 conversion), while polysaccharide-rich cell wall and matrix are shown in green (due to ConA binding). The yellow regions in both panels represent merged red and green channels of the CSLM-derived images. The bars represent 50 μm in panels C and D (magnification, ×19.5).
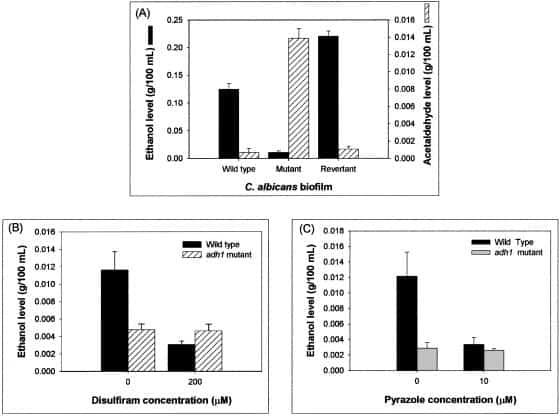
Figure 6
Adh1p catalyzes ethanol production in C. albicans biofilm. Ethanol levels in biofilms incubated with inhibitors were calculated as percentages of ethanol levels in biofilm formed in the absence of ethanol, which were considered as 100%. Supernatants (4 ml each) were collected from biofilms grown to mature phase and then used as samples to determine the ethanol and acetaldehyde levels using specific assay kits according to the manufacturer’s instructions. The levels of ethanol and acetaldehyde were expressed as g/100 ml of sample. Experiments were repeated in triplicate (n = 3). The error bars represent standard deviations.
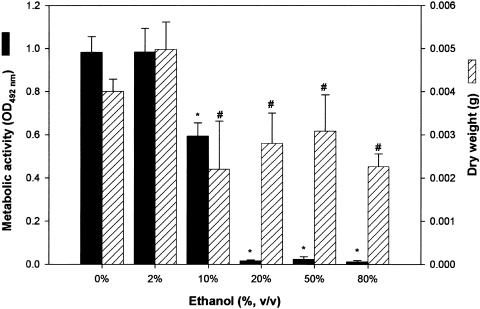
Figure 7
Effects of ethanol on the ability of C. albicans to form biofilm in vitro and in vivo. In vitro biofilm formation in the presence of ethanol was quantitated as metabolic activity (XTT activity) and dry biomass (g) (mean plus standard deviation). Medium containing ethanol at the indicated concentration was added to adhered C. albicans cells, and a biofilm was allowed to form. Significant reduction in Candida biofilm formation was observed in vitro in the presence of 10% ethanol, while biofilm formation was completely inhibited at ethanol concentrations of ≥15%. *, P < 0.001; #, P < 0.05 compared to biofilm formed in the absence of ethanol (0% ethanol control).