
Metabolomics Reveals Differential Levels of Oral Metabolites in Hiv-infected Patients: Toward Novel Diagnostic Targets
Abstract
The objective of the current study was to characterize the profile of oral metabolites in HIV-infected patients using metabolomics. Oral wash samples were collected from 12 HIV-infected and 12 healthy individuals (matched for age, sex, and ethnicity), processed, and analyzed by metabolomics. We detected 198 identifiable and 85 nonidentifiable metabolites; 27 identifiable metabolites were differentially present (12 increased, 15 decreased) in HIV-infected patients. Elevated metabolites included p-cresol sulfate, nucleotides (e.g., allantoin), and amino acids (e.g., phenylalanine, tryptophan), whereas decreased oral metabolites included fucose, fumarate, and N-acetylglucosamine. Pathway network analysis revealed the largest multinode network in healthy versus HIV-infected patients to involve carbohydrate biosynthesis and degradation. HIV-infected patients on antiretroviral therapy (ART) showed the largest number (12) of statistically significant metabolite correlation differences compared with healthy controls. Interestingly, the oral phenlyalanine:tyrosine ratio increased in ART-naive HIV-infected patients (mean ± SEM = 2.58 ± 0.87) compared with healthy individuals (1.33 ± 0.10, p = 0.062) or ART-experienced patients (1.78 ± 0.30, p = 0.441). This is the first study to reveal differential levels of oral metabolites in HIV-infected patients compared withj healthy volunteers, and that oral phenlyalanine:tyrosine ratio may be a useful marker for noninvasive monitoring of the immune status during HIV infection.
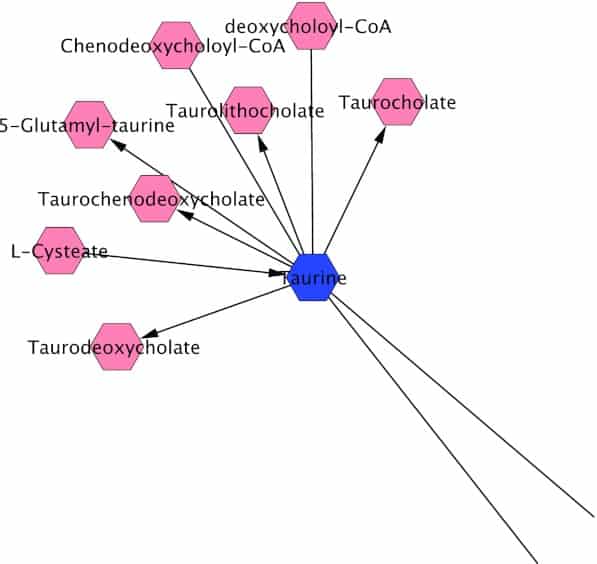
Figure 1
Network connections with a representative metabolite (taurine) present differentially in healthy and HIV-infected patients, interconnected with other metabolites or pathways. Data were analyzed using the Metscape plugin in the open-source Cytoscape software. (Enlarged version of this figure showing all identified metabolites can be viewed in Supplemental Fig. SF1. Data used to generate the Cytoscape network visualization has been provided as Supplemental Table ST2.)
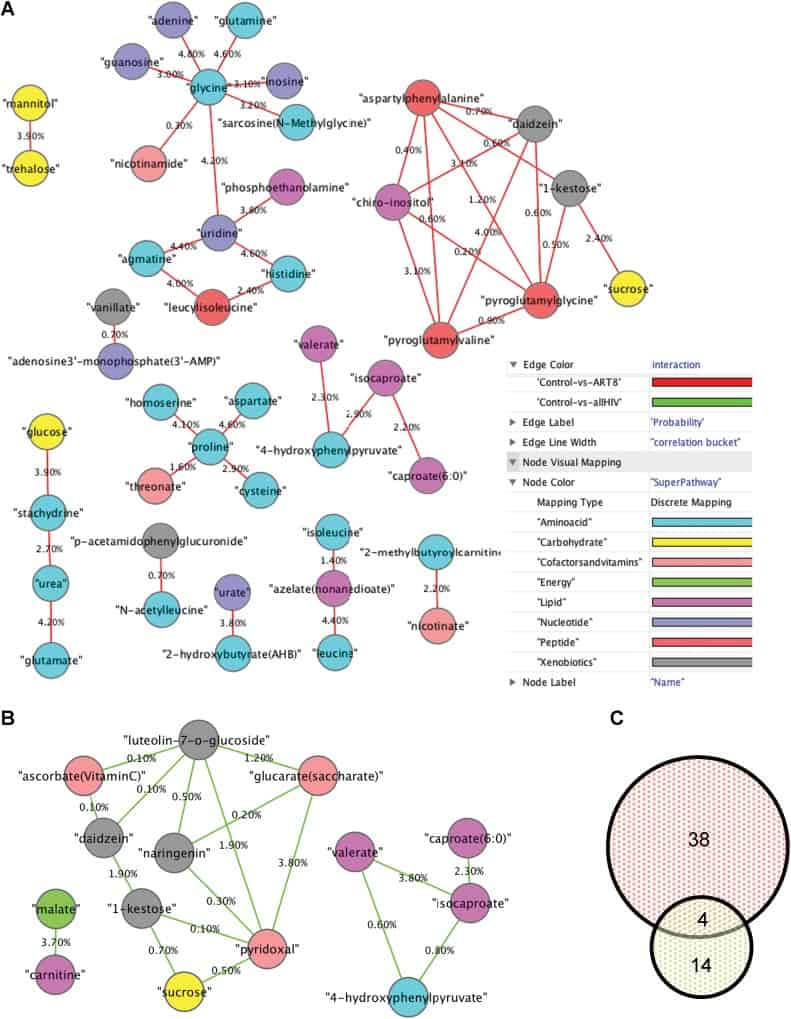
Figure 2
Differential Correlation Network (DCN) analysis of significant correlations between paired metabolite differences in oral wash samples. Correlation differences were calculated for (A) healthy vwersus ART-experienced HIV-infected patients (red edges), and (B) healthy versus HIV-infected (including ART-naive and -experienced) patients (green edges). Metabolite differential correlation (edge) is displayed as percentage significant difference. Visualization was created with Cytoscape (www.cytoscape.org), and the metabolites (nodes) were color coded by their KEGG superpathway. (C) Depicts the number of interactions between metabolites in sampled obtained from healthy versus ART-experienced HIV-infected patients (red) or healthy versus HIV-infected (green).
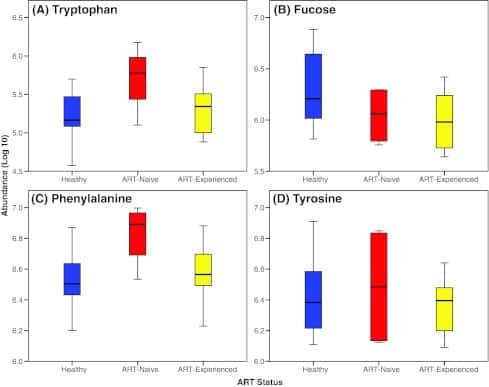
Figure 3
Levels of representative amino acids and carbohydrates in oral wash samples obtained from healthy and HIV-infected patients. (A) Tryptophan; (B) fucose; (C) Phenylalanine; (D) Tyrosine.