
The Artificial Sweetener Splenda Promotes Gut Proteobacteria, Dysbiosis, and Myeloperoxidase Reactivity in Crohn’s Disease-Like Ileitis
Abstract
Background:
Epidemiological studies indicate that the use of artificial sweeteners doubles the risk for Crohn’s disease (CD). Herein, we experimentally quantified the impact of 6-week supplementation with a commercial sweetener (Splenda; ingredients sucralose maltodextrin, 1:99, w/w) on both the severity of CD-like ileitis and the intestinal microbiome alterations using SAMP1/YitFc (SAMP) mice.
Methods:
Metagenomic shotgun DNA sequencing was first used to characterize the microbiome of ileitis-prone SAMP mice. Then, 16S rRNA microbiome sequencing, quantitative polymerase chain reaction, fluorescent in situ hybridization (FISH), bacterial culture, stereomicroscopy, histology, and myeloperoxidase (MPO) activity analyses were then implemented to compare the microbiome and ileitis phenotype in SAMP with that of control ileitis-free AKR/J mice after Splenda supplementation.
Results:
Metagenomics indicated that SAMP mice have a gut microbial phenotype rich in Bacteroidetes, and experiments showed that Helicobacteraceae did not have an exacerbating effect on ileitis. Splenda did not increase the severity of (stereomicroscopic/histological) ileitis; however, biochemically, ileal MPO activity was increased in SAMP treated with Splenda compared with nonsupplemented mice (P < 0.022) and healthy AKR mice. Splenda promoted dysbiosis with expansion of Proteobacteria in all mice, and E. coli overgrowth with increased bacterial infiltration into the ileal lamina propria of SAMP mice. FISH showed increase malX gene-carrying bacterial clusters in the ilea of supplemented SAMP (but not AKR) mice.
Conclusions:
Splenda promoted gut Proteobacteria, dysbiosis, and biochemical MPO reactivity in a spontaneous model of (Bacteroidetes-rich) ileal CD. Our results indicate that although Splenda may promote parallel microbiome alterations in CD-prone and healthy hosts, this did not result in elevated MPO levels in healthy mice, only CD-prone mice. The consumption of sucralose/maltodextrin-containing foods might exacerbate MPO intestinal reactivity only in individuals with a pro-inflammatory predisposition, such as CD.
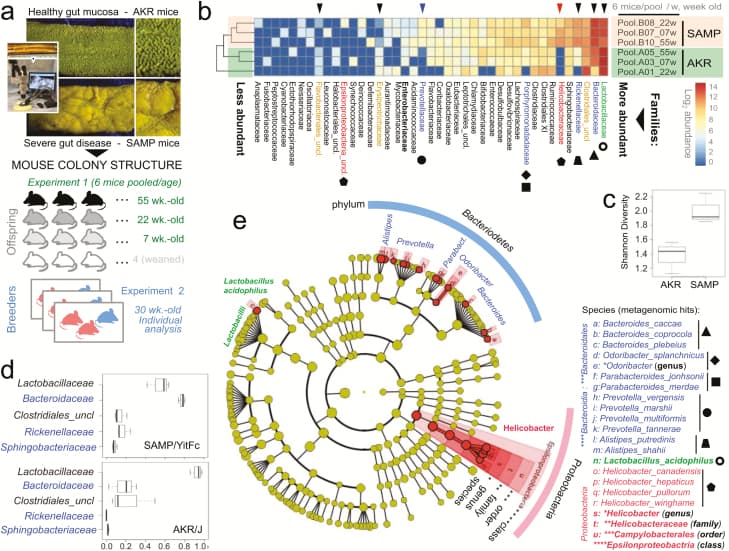
Figure 1
Metagenomic analysis of pooled fecal matter reveals an abundance of Bacteroidetes and Helicobacteraceae in SAMP mice. A, En face stereomicroscopic images of healthy AKR ileal mucosa (top image) and SAMP cobblestone ileitis (bottom image); schematic illustration of metagenomic sampling design in SPF facilities (pooled feces in experiment 1 [summer] vs individual sampling in experiment 2 [8 months later, spring]). B, Multivariable unsupervised hierarchical analysis of metagenomic fecal bacterial abundance from 36 mice pooled as 6 mice per age group (7, 22, and 55 weeks old). Note clustering of AKR and SAMP samples as separate clades. Arrows illustrate distinct families, ranked by abundance across all samples. C, Compared with AKR, the SAMP metagenome have greater bacterial diversity (Shannon diversity). D, Boxplots reveal reduction of Firmicutes (Lactobacillaceae and Clostridiales) and expansion of Bacteroidetes families in SAMP (eg, Bacteroidaceae, Rickenellaceae, Sphingobacteriaceae). E, Circular diagram of relative taxonomic metagenomic abundance in phylogenetic tree format highlights significant enrichment of Helicobacteraceae (Proteobacteria phylum), and 4 of 6 known Bacteroidetesphylum families (Bacteroidaceae, Rickenellaceae, Porphyromonadaceae, and Prevotellaceae) in SAMP mice (1-tailed Fisher exact P = 0.046).
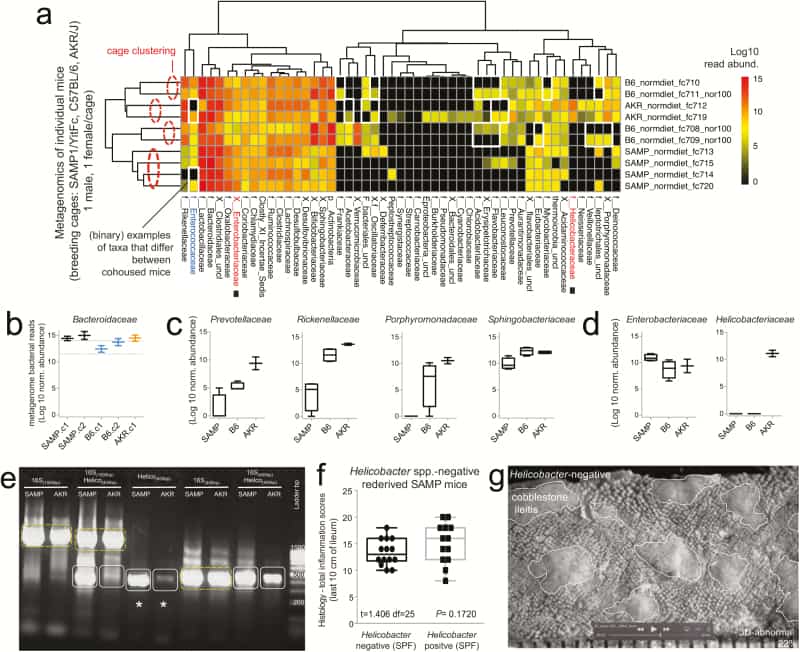
Figure 2
Metagenomic analysis reveals Helicobacter variability with minimal effect on SAMP ileitis. A, Individual fecal metagenomic analysis of breeder mice was performed 8 months after the previously pooled fecal sampling experiment, demonstrating bacterial profiles with reproducible cluster within pairs of breeders for each individual cage. Squares highlight absence of Helicobacteraceae in Helicobacteraceae-negative SAMP colony. When present, Helicobacteraceae was highly abundant in the feces of positive mice. Analysis highlights within-cage mouse microbiota individualities, eg, Enterococcaceae. B, Boxplots, showing averages for each cage, reveal high abundance of Bacteroidaceae in SAMP mice (compared with experiment 1 in Fig. 1D). C, The abundance of other Bacteroidetes is shown by boxplots. D, Compared with AKR and B6 mice, SAMP had a significantly higher level of Enterobacteracea (a family that contains Escherichia coli). Notice marked abundance of dichotomous variability of Helicobacteraceae in mice. E, Gel electrophoresis of PCR amplified target regions of Helicobacter spp. within the 16S rRNA gene from fecal DNA of random mice form our SAMP and AKR colony, 4 months after the individual fecal metagenomic experiment. Notice high band intensity in SAMP (asterisks). Universal and PCR-specific primers were used to generate full or partial gene amplicons (1500 or 400 bp). F, Histological inflammation scores of distal ileum from rederived Helicobacter-negative SAMP compared with that of the SAMP colony show no differences. Notice wider variability in Helicobacter-positive mice. G, Representative snapshot of videostereomicroscopy shows unchanged morphological appearance of ileal mucosal surface in Helicobacter-negative SAMP mice. Scale = 500 um.
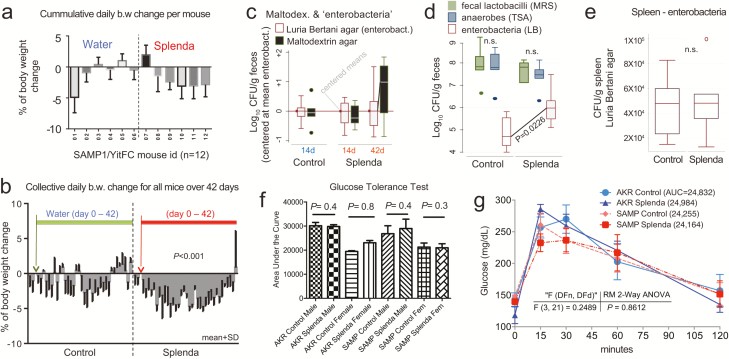
Figure 3
Effects of Splenda on body weight, fecal bacteria, and glucose tolerance in SAMP mice. A, Mean body weight change in 12 SAMP mice (individually caged, 7 days of adaptation, more than 42 days of supplementation of drinking water with and without low-dose Splenda). B, Daily group average of body weight change over time; low Splenda dose. C, Bacterial enumeration from feces using standard LB agar (used for enterobacteria) and in-house “maltodextrin agar.” Notice maltodextrin agar yielded an increasing bacterial count trend toward the end of study in the Splenda group (GLM P > 0.05; relative to centered log-transformed data for LB agar). Supplementary Figure 1 illustrates other in-house agars, yeast extract agar, and Splenda agar yielding similar trends, compared with LB agar. D, Total number of anaerobes (TSA), lactobacilli (MRS agar), and enterobacteria (LB) after 42 days of Splenda supplementation in SAMP mice (unpaired t test, n = 6/group). E, The total number of enterobacteria in the spleen suggests that Splenda had no systemic bacteremic effect. F, Glucose tolerance test on day 40 with animals with Splenda supplementation in experiment 2 (high FDA-approved dose). Notice the lack of significant effect across experimental mice. G, Glucose tolerance test curves illustrated as mean ± SD. Univariate analysis across time points showed no differences due to Splenda. Abbreviation: AUC, area under the curve (n = 6 mice/group).
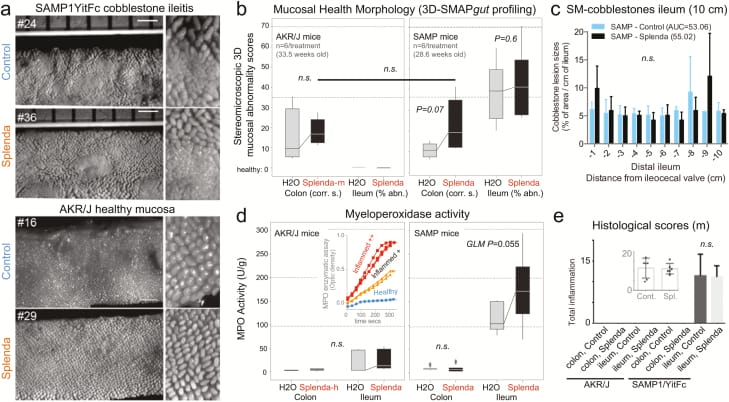
Figure 4
Splenda has no effect on 3D-SM or histological scores but promotes tissue MPO activity in mice with ileitis. A, En face stereomicroscopic images of AKR and SAMP ileal mucosa after 47 days of supplementation of Splenda at the maximum FDA-approved dose (experiment 2, medium dose, AKR vs SAMP mice, n = 6/group, supplementation started at 25.2 ± 2.4 weeks of age). Notice similar 3D stereoenterotype for SAMP cobblestone ileitis and the healthy mucosa in AKR mice. B, Cumulative 3D-SMAPgut scores on mucosal surface morphology for the colon (corrugation score/cm) and ileum (percentage of abnormal mucosa). Despite the positive trend (upward lines connecting means), there was no statistical difference between groups in all 3 Splenda experiments, irrespective of dose. C, Average size for average cobblestone for each centimeter of the distal ileum. D, MPO activity from colon and ileum tissue at the end of the experiment. Notice that increased MPO occurred only in mice with ileitis. Inset: Example of MPO activity for 3 tissues with different MPO reactivities. Notice the reproducibility among triplicates (Supplementary Table 1). E, Histological scores of the colon and ileum. Notice that there were no differences between groups.
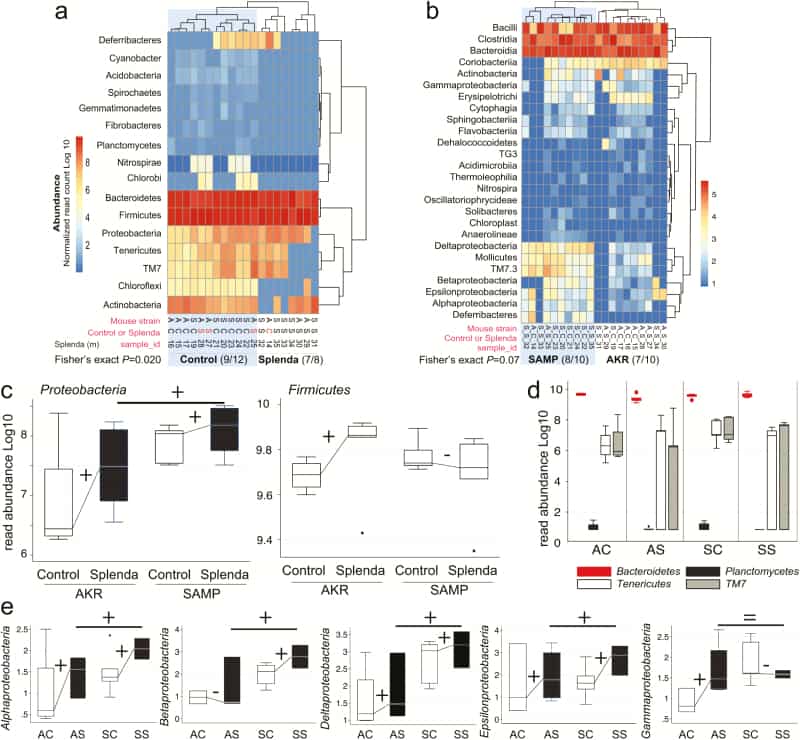
Figure 5
Splenda promotes gut dysbiosis characterized by enrichment of Proteobacteria in mice. A, Phylum analysis. 16S rRNA gene copy microbiome abundance normalized and presented as an unsupervised clustered hierarchical heat map that illustrates a significant effect attributable to Splenda (increase in Proteobacteria and reduction of other phyla including Chloroflexi; P = 0.02). Note the high relative abundance of Bacteroidetes with respect to Firmicutes. Notice that when present several proteobacterial classes contribute to microbiome separation between SAMP and AKR (P = 0.07). Notice highly abundant Bacteroidia, Bacilli, and Clostridia cluster at the top of the panel. C, Boxplot illustrates the effect of Splenda on phylum Proteobacteria, compared with Firmicutes. Lines connecting normalized averages indicate positive trends. D, Boxplot illustrates high Bacteroidetes abundance and the comparative reduction of other phyla in Splenda-treated mice. E, Bacterial abundance across all 5 Proteobacteria classes detected in the study. Sign binomial statistics of means in log10 scale suggests that Splenda promotes a positive effect (including (C); 10/12 were positive, 2/12 were negative, 1-tail sign P = 0.019). Abbreviations, C, control water; diet S, Splenda; mouse A, AKR/J; S, SAMP. B, Class analysis.
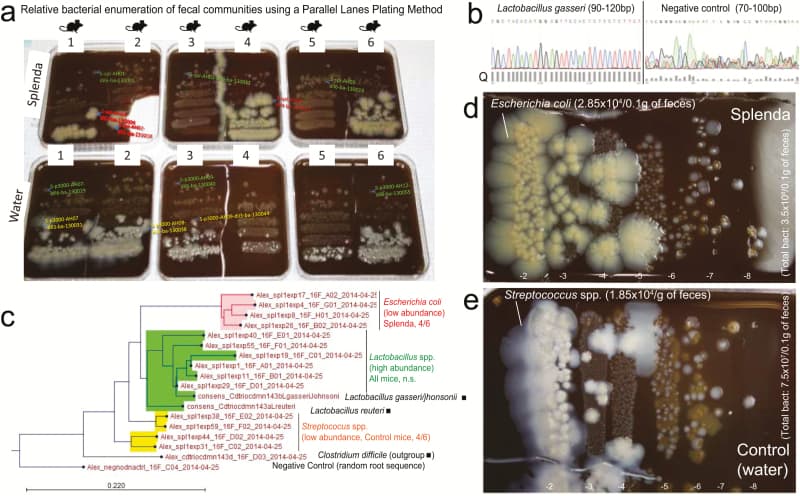
Figure 6
Splenda promotes the replacement of Streptococcus spp. with E. coli in the intestinal tract of SAMP mice. A, “Parallel Lanes Plating” Method. Photograph of BHI agar plates supplemented with 5% sheep defibrinated blood inoculated with 10-fold serial dilutions of feces from SAMP mice using a parallel minidrop slide and lanes method developed for tracking and relative enumeration of complex bacterial communities (Supplementary Fig. 1). Mice were caged individually and exposed to a composite of bedding and feces (IsPreFeH) prior to receiving Splenda at a low dose (1.5 mg/mL) or water for 42 days. Representative colonies comprising all possible morphologies in each agar plate were selected for purification and Sanger sequencing for speciation (from high dilutions, green labels; and low dilutions, pink or red labels). Notice the colony morphology (large, thick, spreading) of 4/6 mice in the Splenda group is different from that of 4/6 control mice (whitish, smaller). B, Sanger sequence chromatograph. Single-colony PCR revealed Lactobacillus gasseri (umbonate, brown) as the most common abundant bacteria in mice, unaffected by Splenda supplementation (see the panels below). Q, quality of consensus sequence. C, Phylogenetic analysis of 16S rRNA paired-end consensus sequences revealed that the whitish colonies in the control (water) group were closely related to Streptococcus spp., while bacteria in Splenda mice were E. coli. D and E, Close-up of colony morphologies on BHI agar after 5 days of aerobic incubation. Notice the “parallel lanes method” of 2 mice representing the Splenda and control groups. Negative numbers indicate 10-fold dilution factor.
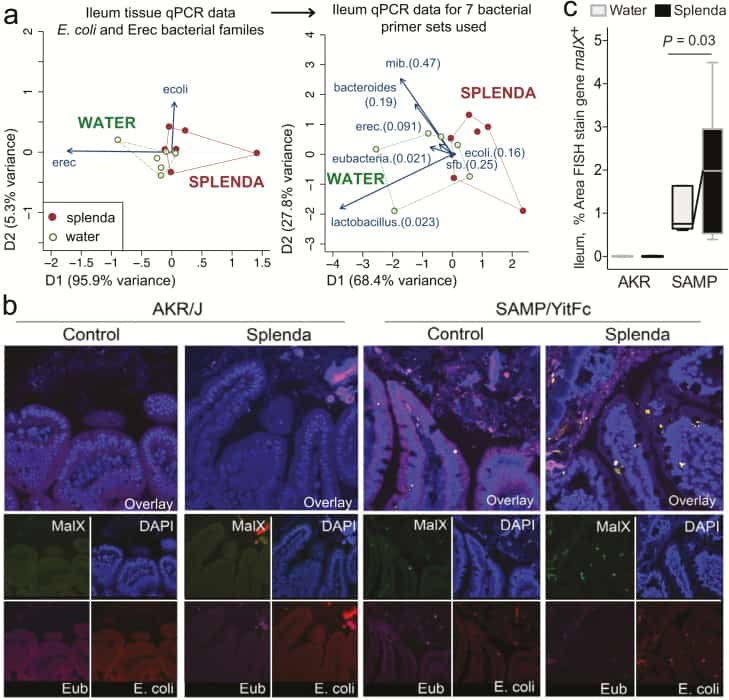
Figure 7
Bacterial qPCR and FISH staining of ileal tissue illustrates distinct microbiota and increased invasive malX+ bacteria (E. coli) in Splenda-supplemented SAMP but not AKR mice. A, Multivariate analysis of DNA qPCR data from ileum tissues of SAMP mice after 42 days of supplementation. Notice the display of mice (points) and the vector influence of the variables (arrows) on the overall matrix data variability (D1 and D2) for the E. coli and Erec primers, and for all the 7 primer sets used in this study. Hotelling’s T-test P values are in parentheses. Notice the separation of the 2 clusters (water, Splenda). B, Ileal sections from SAMP mice supplemented with 3.5% Splenda for 42 days (Splenda) or nontreated control mice (Water) were hybridized with probes to Eubacteria (purple), E. coli (red), and malX (maldodextrin, green), a component of the maltose/maltodextrin metabolism system. Cell nuclei are visualized with DAPI (blue). Images shown are representative of analyses performed in 5 mice per group. Notice the presence of E. coli in both the epithelial layer and the subepithelial lamina propria tissue (villi), and the large bacterial clusters in the lamina propria of SAMP mice on the Splenda panels. C, Percentage of area that stained positive for the malX gene probe (pixels, malX+ area/total tissue area*100). Unpaired t test statistics. A minimum of 4 fields were analyzed/sampled using ImageProPlus v7 software (AKR control, n = 4; AKR Splenda, n = 6; SAMP control, n = 6; SAMP Splenda, n = 10).