Bacteriome and Mycobiome Associations in Oral Tongue Cancer
Abstract
Squamous cell carcinoma of the oral (mobile) tongue (OMTC), a non-human papilloma virus-associated oral cancer, is rapidly increasing without clear etiology. Poor oral hygiene has been associated with oral cancers, suggesting that oral bacteriome (bacterial community) and mycobiome (fungal community) could play a role. While the bacteriome is increasingly recognized as an active participant in health, the role of the mycobiome has not been studied in OMTC. Tissue DNA was extracted from 39 paired tumor and adjacent normal tissues from patients with OMTC. Microbiome profiling, principal coordinate, and dissimilarity index analyses showed bacterial diversity and richness, and fungal richness, were significantly reduced in tumor tissue (TT) compared to their matched non-tumor tissues (NTT, P<0.006). Firmicutes was the most abundant bacterial phylum, which was significantly increased in TT compared to NTT (48% vs. 40%, respectively; P=0.004). Abundance of Bacteroidetes and Fusobacteria were significantly decreased in TT compared to matched NTT (P≤0.003 for both). Abundance of 22 bacterial and 7 fungal genera was significantly different between the TT and NTT, including Streptococcus, which was the most abundant and significantly increased in the tumor group (34% vs. 22%, P<0.001). Abundance of fungal genus Aspergillus in TT correlated negatively with bacteria (Actinomyces, Prevotella, Streptococcus), but positively with Aggregatibacter. Patients with high T-stage disease had lower mean differences between TT and NTT compared with patients with low T-stage disease (0.07 vs. 0.21, P=0.04). Our results demonstrate differences in bacteriome and mycobiome between OMTC and their matched normal oral epithelium, and their association with T-stage.
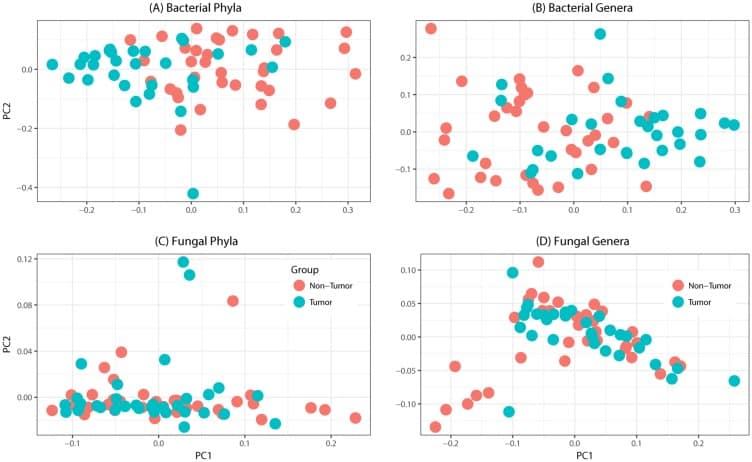
Figure 1
Principal coordinates analysis of oral tongue tumor samples and matched non-tumor oral epithelium samples at the phylum (left) and genus (right) levels for (A-B) bacteriome or (C-D) mycobiome. Overall oral microbiomic diversity of patient tumor (green) and matched non-tumor (orange) samples as represented by the first two principal coordinates on principal coordinates analysis of unweighted UniFrac distances. Each point represents a single sample.
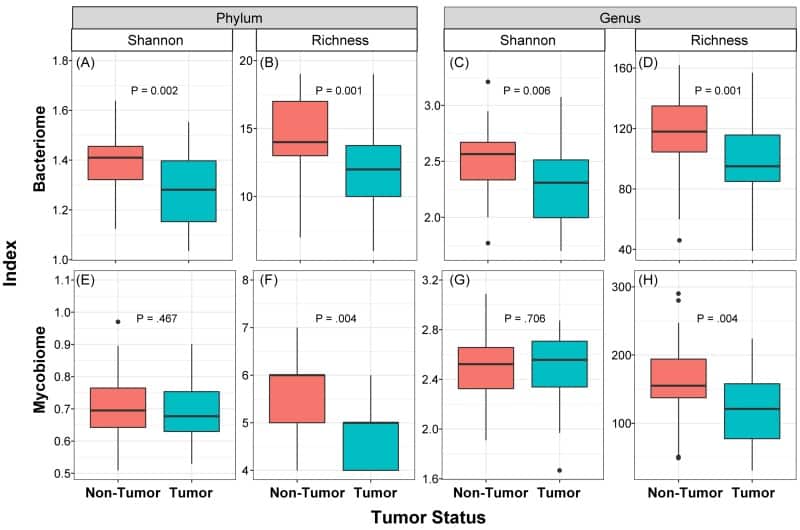
Figure 2
Box and whisker plots of diversity and richness of mycobiome and bacteriome at the phylum and genus levels from oral tongue tumor (green) and their matched non-tumor (orange) samples
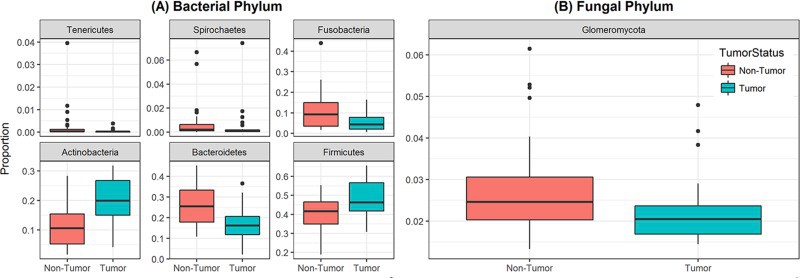
Figure 3
Box and whisker plots of relative abundance of the 6 bacterial phyla and one fungal phylum found significantly different between oral tongue tumor samples and their matched normal tissue samples
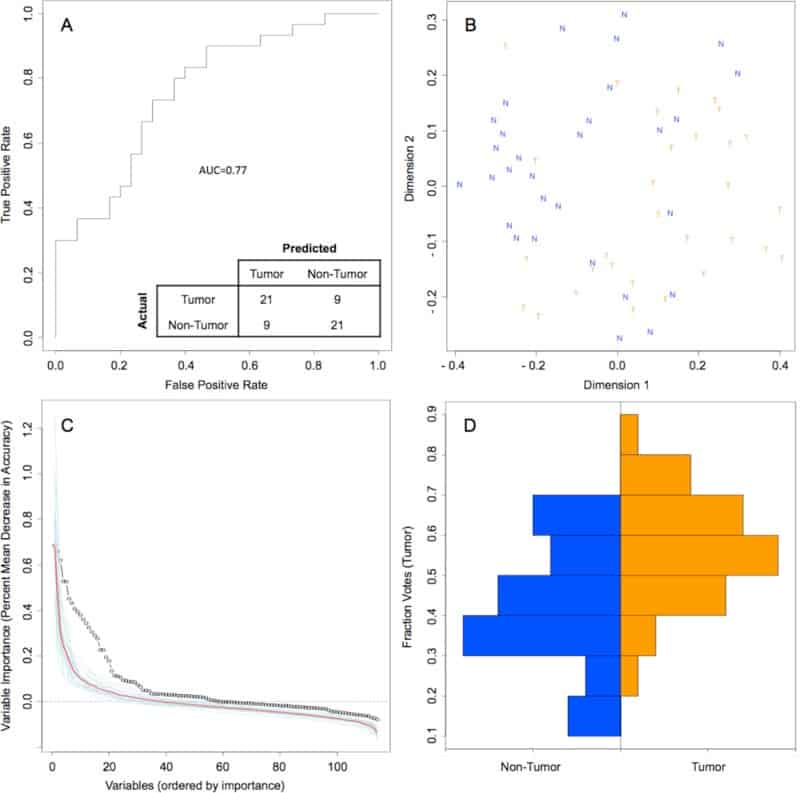
Figure 4
Random Forest model of genus-level bacteriome and mycobiome of oral tongue tumors compared to matched non-tumor tissues
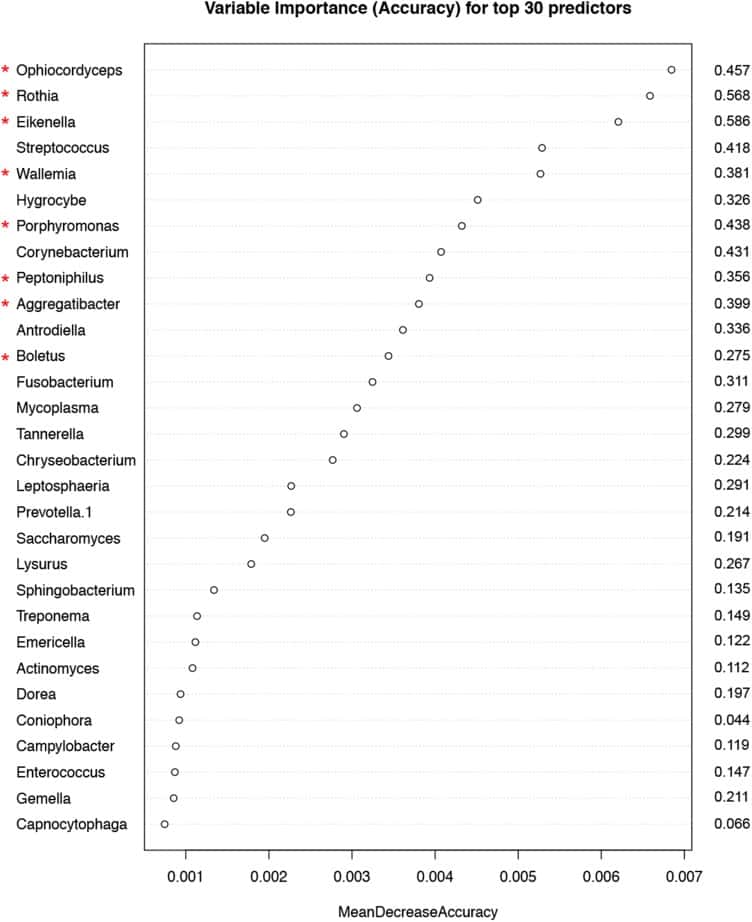
Figure 5
Variable importance measured by mean decrease in accuracy of top 30 predictor genera in the Random Forest (RF) model
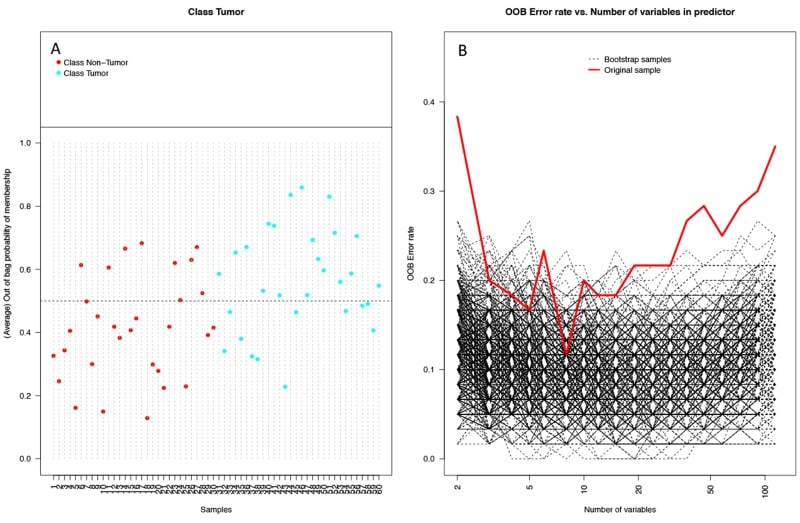
Figure 6
Performance of random forest (RF) model on 1000 bootstrap samples
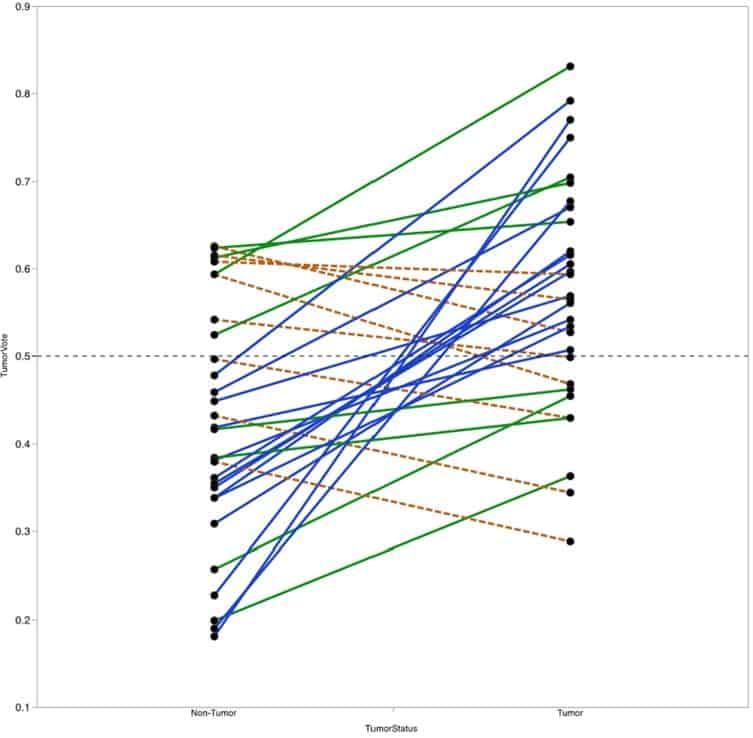
Figure 7
Vote fraction between matched tumor and non-tumor samples
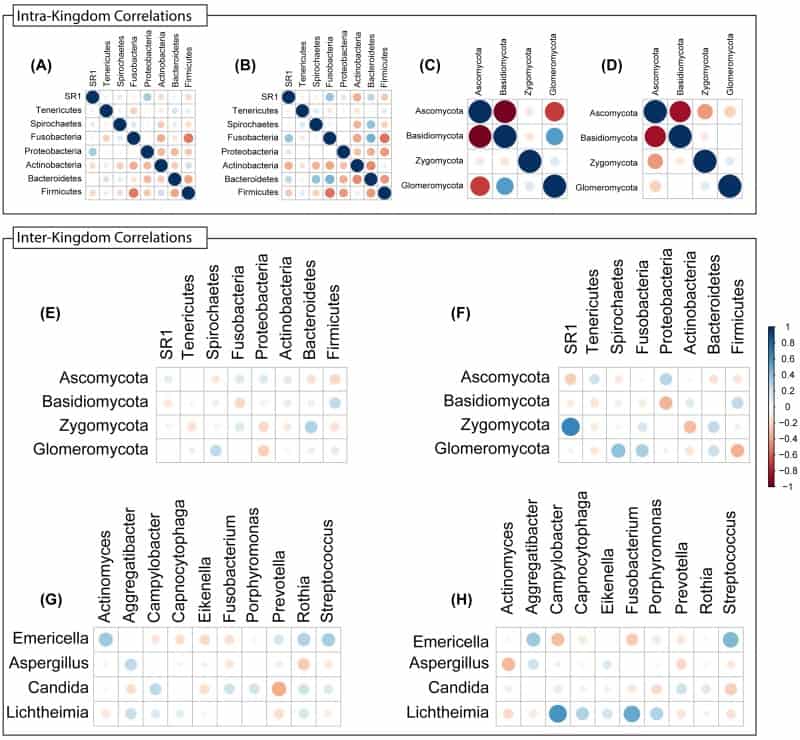
Figure 8
Intra- and Inter-Kingdom correlations at phylum and genus levels