
Metabolomic Analysis Identifies Differentially Produced Oral Metabolites, Including the Oncometabolite 2-hydroxyglutarate, in Patients with Head and Neck Squamous Cell Carcinoma
Abstract
Background:
Metabolomics represents a promising approach for discovering novel targets and biomarkers in head and neck squamous cell carcinoma (HNSCC). Here we used metabolomics to identify oral metabolites associated with HNSCC.
Methods:
Tumor and adjacent normal tissue from surgical resections and presurgical oral washes as well as oral washes were collected from healthy participants. Metabolites extractions of these samples were analyzed by liquid chromatography-mass spectroscopy (LC/MS), LC/MS/MS and gas chromatography-MS (GC/MS).
Results:
Among 28 samples obtained from 7 HNSCC cases and 7 controls, 422 metabolites were detected (269 identified and 153 unidentified). Oral washes contained 12 and 23 metabolites in healthy controls and HNSCC patients, respectively, with phosphate and lactate being the most abundant. Small molecules related to energy metabolism were significantly elevated in HNSCC patients compared to controls. Levels of beta-alanine, alpha-hydroxyisovalerate, tryptophan, and hexanoylcarnitine were elevated in HNSCC oral washes compared to healthy controls (range 7.8-12.2-fold). Resection tissues contained 22 metabolites, of which eight were overproduced in tumor by 1.9- to 12-fold compared to controls. TCA cycle analogs 2-hydroxyglutarate (2-HG) and 3-GMP were detected exclusively in tumor tissues. Targeted quantification of 2-HG in a representative HNSCC patient showed increase in tumor tissue (14.7 μg/mL), but undetectable in normal tissue. Moreover, high levels of 2-HG were detected in HNSCC cell lines but not in healthy primary oral keratinocyte cultures.
Conclusions:
Oral metabolites related to energy metabolism were elevated in HNSCC, and acylcarnitine and 2HG may have potential as non-invasive biomarkers. Further validation in clinical studies is warranted.
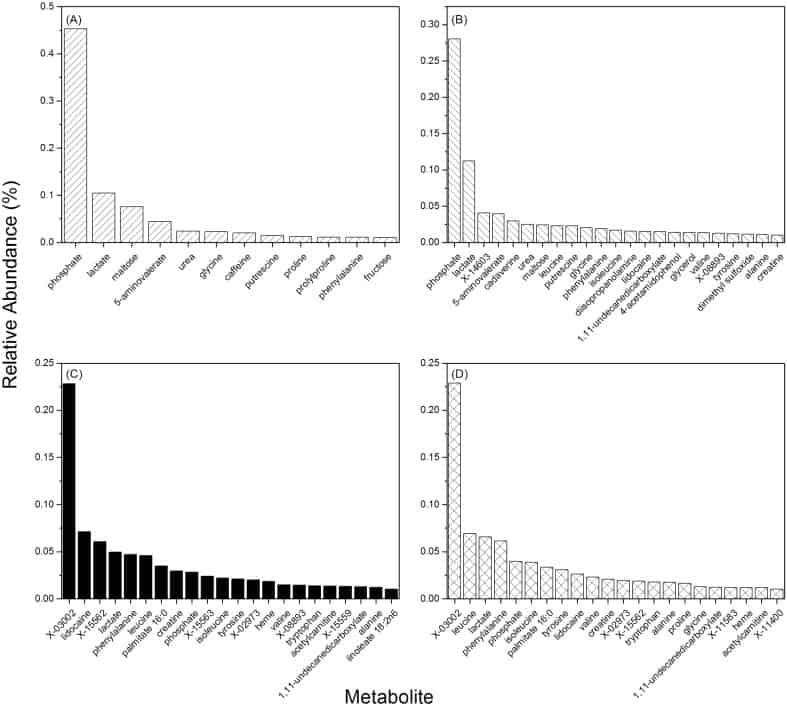
Figure 1
Metabolites with abundance ≥ 1% in oral wash and resection tissue. (A) Oral wash from non-diseased or (B) HNSCC patients; (C) Adjacent normal tissue or (D) tumor tissues for surgical resection of HNSCC patients.
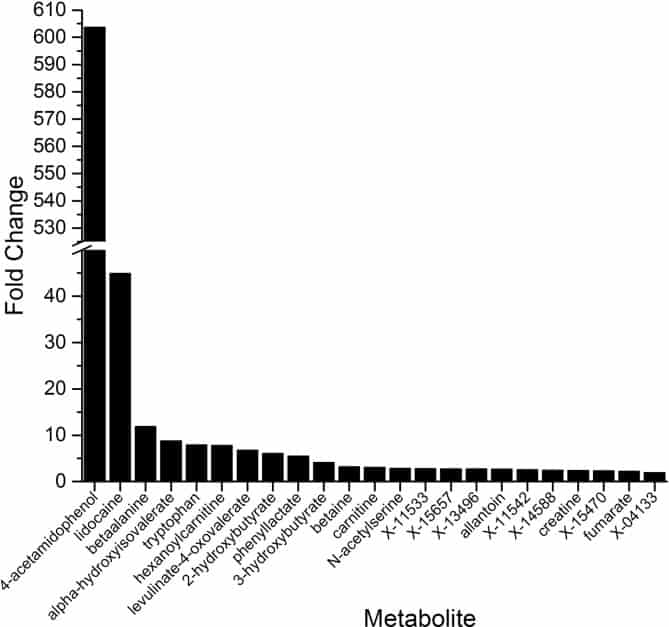
Figure 2
Fold-change in levels of metabolites detected in oral wash of HNSCC patients compared to oral wash of non-diseased individuals. Bars represent HNSCC:normal ratio of metabolite levels (P ≤ 0.038 for all comparisons; P-value range = 0.038-5.83E-41).
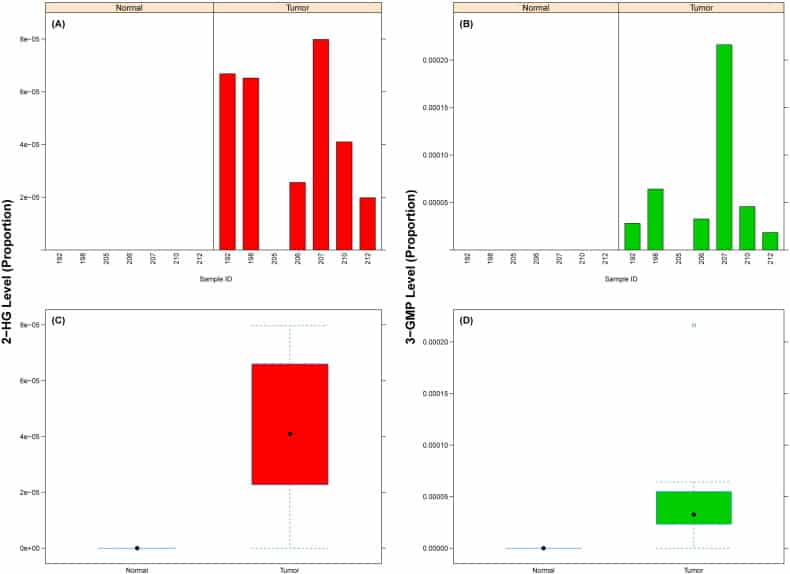
Figure 3
Relative levels of (A,C) 2-hydroxyglutarate (2-HG) and (B,D) glycerol-3-monophopsphate (3-GMP) in tissue samples. (A,B) levels across all samples, and (C,D) box-plots showing summary distribution for each group (Normal or Tumor).
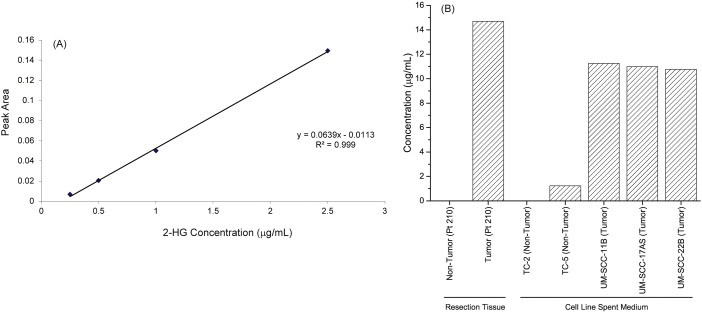
Figure 4
Directed measurement of 2-hydroxyglutarate (2-HG). (A) Standard curve using pure 2-HG, (B) 2-HG levels in tissue samples from a representative patient (Pt. 210), and in spent media of non-tumor and tumor cell lines.
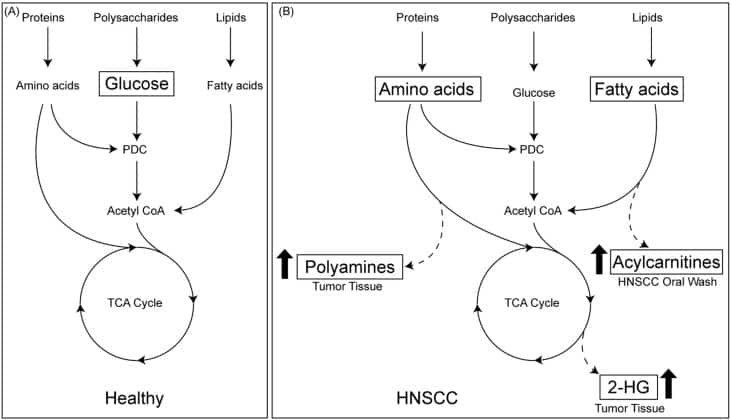
Figure 5
Schema showing HNSCC-associated changes in metabolic flux. (A) Metabolic processes in healthy, non-cancer cells, with energy flow driven primarily by glucose metabolism (glycolysis, TCA cycle). In cancer cells (B), levels of acyl carnitines and polyamines are elevated, suggesting amino acid and fatty acid metabolism to be major sources of energy production. Cancer cells also produce 2HG, indicating specific variations in the TCA cycle.